Results and Outlook
SEASONALITY AND QUARTERLY FINANCIAL INFORMATION
The following table shows condensed financial data for the previous eight quarters. This quarterly information is unaudited, but has been prepared on the same basis as the annual consolidated financial statements. We discuss the factors that caused our results to vary over the past eight quarters throughout this management discussion and analysis.
| (in thousands of Canadian dollars) | For the year ended March 31, 2015 | For the year ended March 31, 2014 | ||||||
| Q1 | Q2 | Q3 | Q4 | Q1 | Q2 | Q3 | Q4 | |
| Revenue | 192,592 | 138,129 | 142,971 | 126,443 | 184,152 | 127,568 | 189,897 | 266,213 |
| Expenses | (469,521) | (362,923) | (416,216) | (473,632) | (467,000) | (387,480) | (460,893) | (558,344) |
| Government funding | 247,755 | 128,177 | 265,305 | 394,859 | 253,982 | 266,392 | 230,585 | 339,939 |
| Net results before non-operating items | (29,174) | (96,617) | (7,940) | 47,670 | (28,866) | 6,480 | (40,411) | 47,808 |
| Non-operating items | (4,395) | 43,410 | 1,988 | (2,333) | (1,515) | (759) | (286) | (404) |
| Net results under IFRS | (33,569) | (53,207) | (5,952) | 45,337 | (30,381) | 5,721 | (40,697) | 47,404 |
| Results on a Current Operating Basis | (7,421) | (55,536) | 15,394 | 66,787 | (590) | 9,443 | (15,841) | 53,417 |
Our operating results are subject to seasonal fluctuations that materially impact quarter-to-quarter operating results.
Historically, our operating results have been seasonal, with the third and fourth quarters of each financial year typically being higher, as both additional revenue and expenses were incurred to broadcast both regular season and playoff hockey games. With the end of CBC’s contract with the NHL in June 2014, we expect the seasonality of our revenue will be less specific and generally more reflective of market, economic and viewership patterns affecting all conventional broadcasters. Revenue generated during the second quarter of the year is usually at its lowest level because the summer season attracts fewer viewers. In contrast, revenue in the third quarter is comparably higher as both television use and the propensity to spend rises significantly during the Christmas season.
Advertising Revenue by Quarter
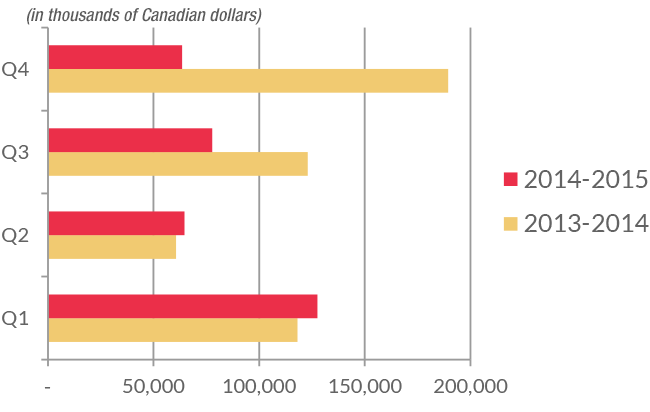
Higher revenue in the first and second quarter of 2014-2015 relative to last year was mainly driven by the impact on advertising revenue of our coverage of the FIFA 2014 World Cup Brazil in the summer of 2014. Lower revenue for the third and fourth quarters of this year relative to 2013-2014 resulted mainly from the inclusion of Sochi 2014 Winter Olympic Games coverage in our advertising revenue last year and the loss of hockey-related advertising revenue this fiscal year following the end of our contract with the NHL.
Expenses also tend to follow a seasonal pattern because they are influenced by the programming schedule. As shown previously, expenses were relatively low in the second quarters of 2014-2015 and 2013-2014. Operating costs tend to be higher in the fourth quarter as the Corporation incurs costs preparing for the fall broadcasting season and completes project deliverables due by the end of the fiscal year. High expenses in the first quarter of 2014-2015 were mostly attributable to the costs incurred to cover the FIFA 2014 World Cup and those associated with the implementation of restructuring initiatives, consistent with our new strategic plan, A space for us all. Comparatively, higher expenses in the third and fourth quarters of last year were mainly due to higher programming costs for both the coverage of the Sochi 2014 Olympic Winter Games and Hockey Night in Canada.

Shailyn Pierre-Dixon and Aunjanve Ellis on The Book of Negroes red carpet – CBC Television
Government funding is recognized in the Corporation’s income based on budgeted net expenses for the quarter. Monthly and quarterly budgets are established from the annual budget approved by the Board of Directors at the beginning of each year, and reflect expected appropriation funding for the year and seasonal impacts on expenditures and self-generated revenue.
Other factors may impact net results from quarter to quarter. These may include foreign exchange gains or losses, changes to the fair value of derivative financial instruments, asset impairments and sales. When appropriate, these are recorded as non-operating items. As indicated in the table, the Corporation recorded higher levels of non-operating gains and losses in 2014-2015 compared to 2013-2014 following the gain of $33.5 million from the sale of a portion of our investment in the share capital of SiriusXM.