YEAR IN REVIEW HIGHLIGHTS
PERFORMANCE HIGHLIGHTS
Measuring Our Mandate and Vision
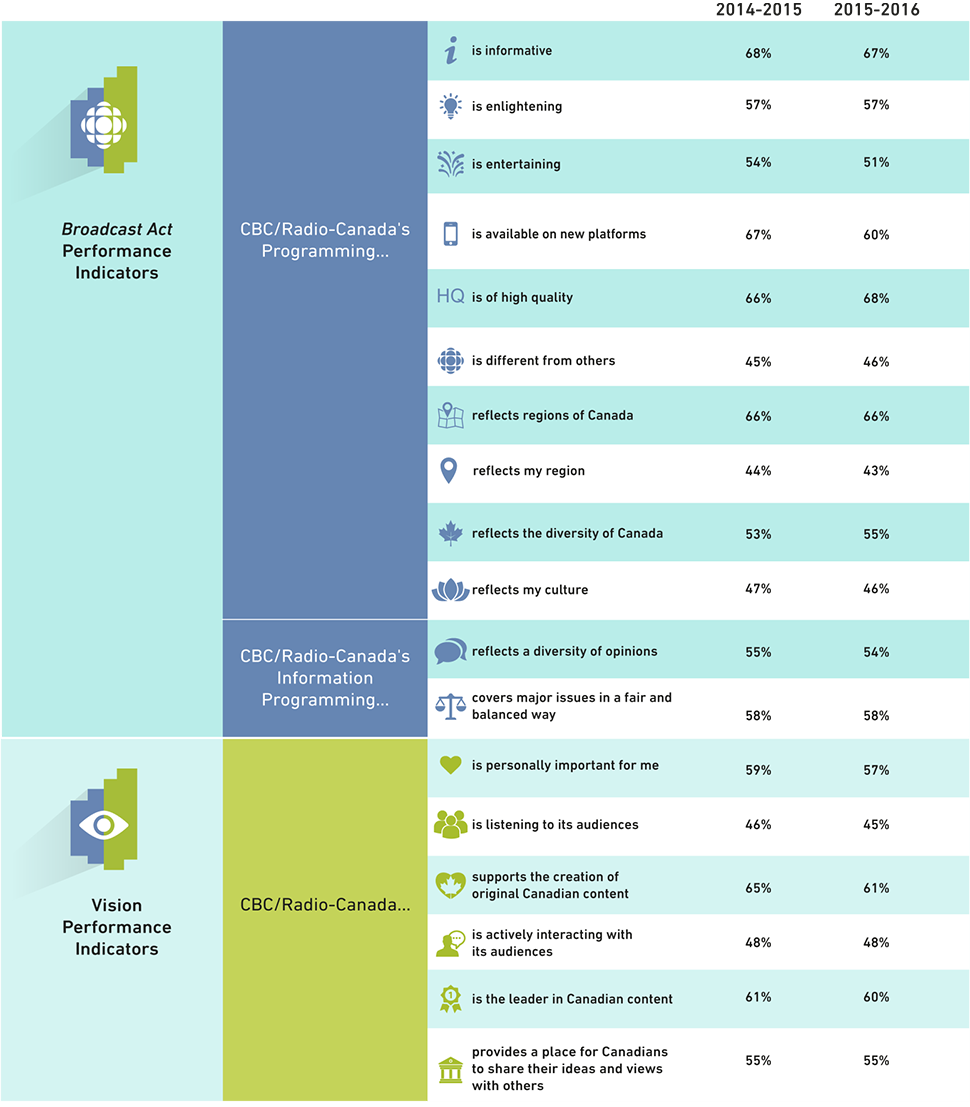
The latest survey results and highlights follow. These results are based on Canadians who gave CBC/Radio-Canada top marks (i.e. an 8, 9 or, 10 on a 10-point scale). For those looking for more detailed results, we are moving reporting into the digital age. We have published the data online in an interactive dashboard for all Canadians to access here.
Here are some highlights of the survey:
- Most of the 2015-2016 metrics remained stable compared to the previous year’s results;
- The top three perception scores show that CBC/Radio-Canada’s programming is of high quality (68%), is informative (67%) and reflects the regions of Canada (66%);
- Canadians typically perceive us as a leader in making our programming available on new platforms, however the 2015-2016 result decreased seven points to 60% compared to last year; and
- The supporting the creation of original Canadian content and entertaining scores also dropped slightly, by four and three percentage points respectively since last year.
Results – Percentages Calculated Amongst the Canadians Who Gave CBC/Radio-Canada Top Marks (8, 9, or 10 on a 10-point scale)(1)

(1)Source: Mission Metrics Survey, TNS Canada (1,000 Anglophones and 1,000 Francophones per survey). Surveys are conducted in November and March each year.
